Overview
Let’s start with an overview of performance in the financial and commodities markets year to date.
Note: Click on the charts below to view full-size versions. 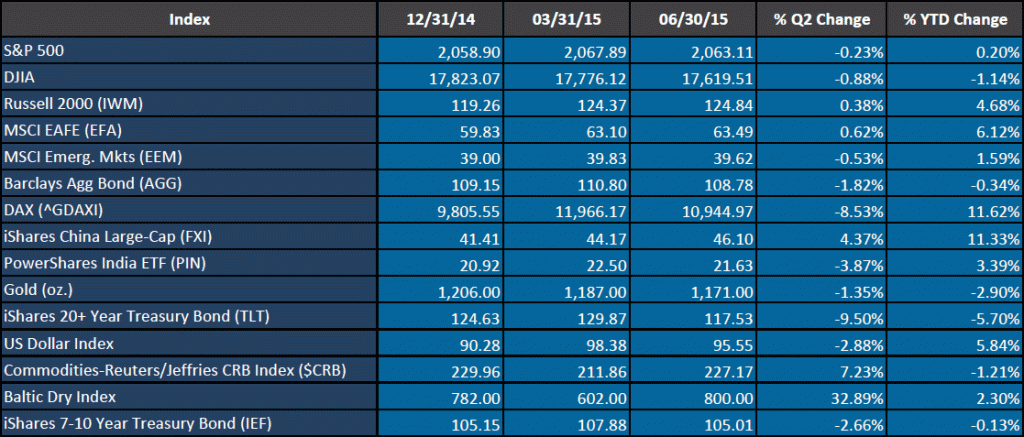
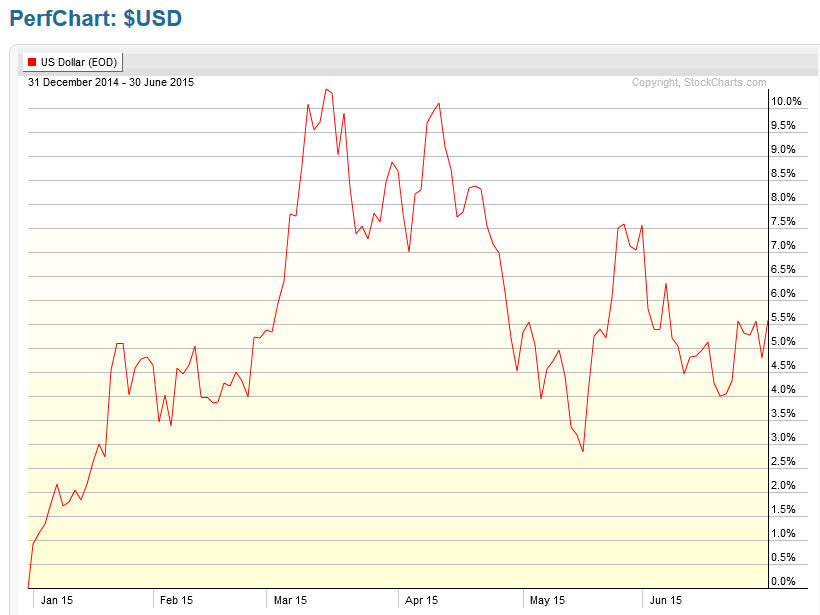
After rising 12% in 2014, the US Dollar Index continued to rise strongly in the first quarter and then consolidated in the 2nd quarter, now up 5.8% for the year.
US Dollar Index
US Equities
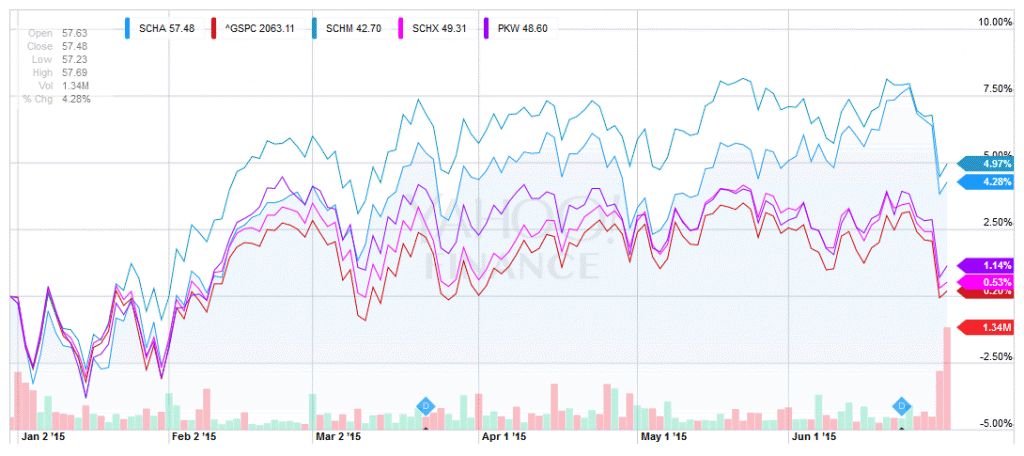
While the S&P was essentially flat for the first half of the year, small-caps and mid-caps continued to perform.
SCHA, SCHM, SCHX, PKW
Real estate was the strongest sector globally.
Morningstar Sectors
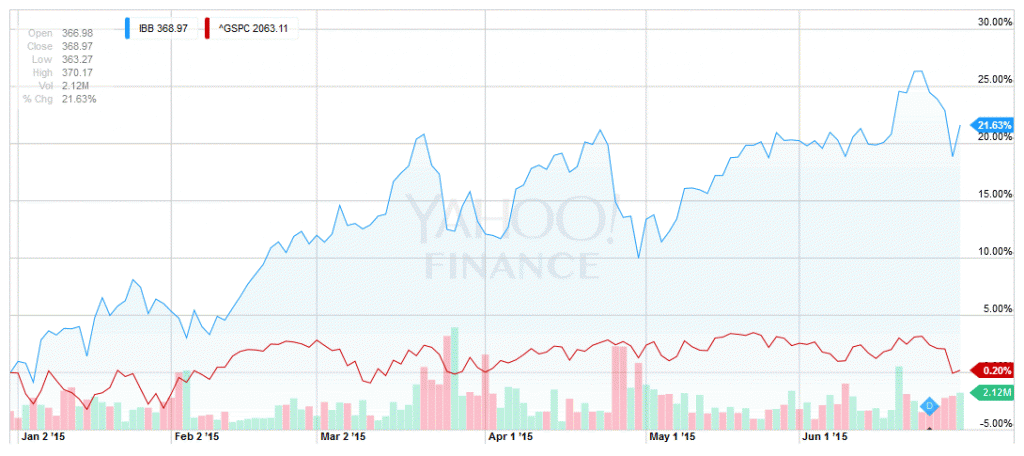
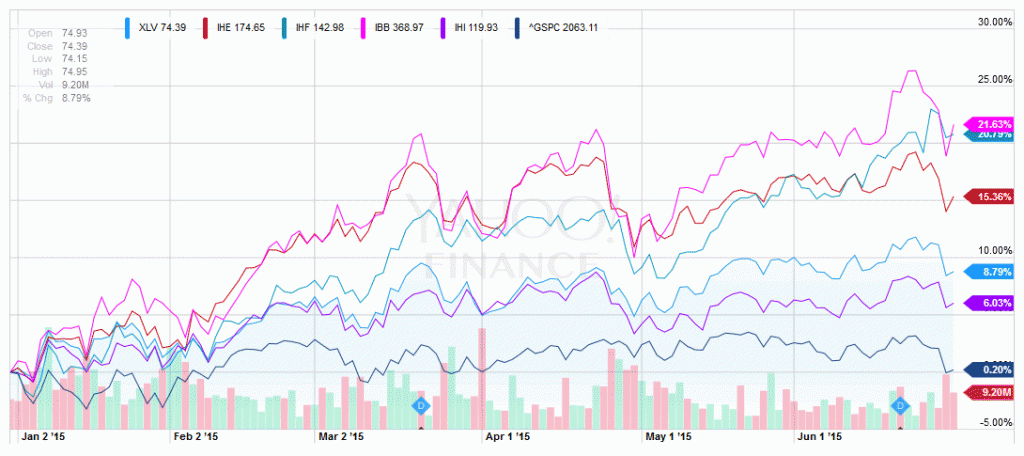
Meantime in the US, federal policies ensured a strong corporate health care sector and an increasing number of proposed large mergers in the health care industry.
IBB – Biotech
Obamacare ETFs: XLV(Health Care Select), IHE (US Pharmaceuticals), IHF (Providers), IBB (Biotech),
IHI (Medical Devices)
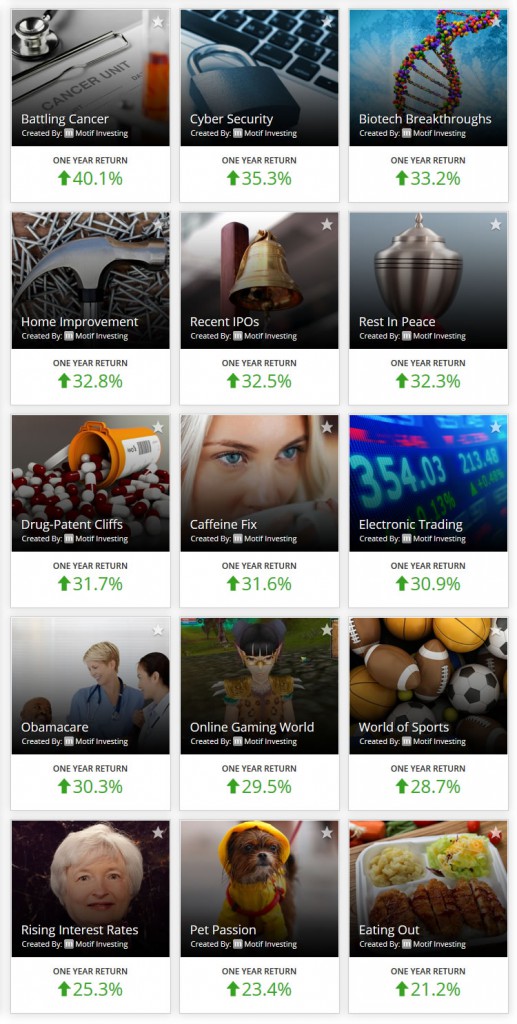
Curing cancer and preventing hacking topped the 1 year returns at Motif Investing.
Motif Investing
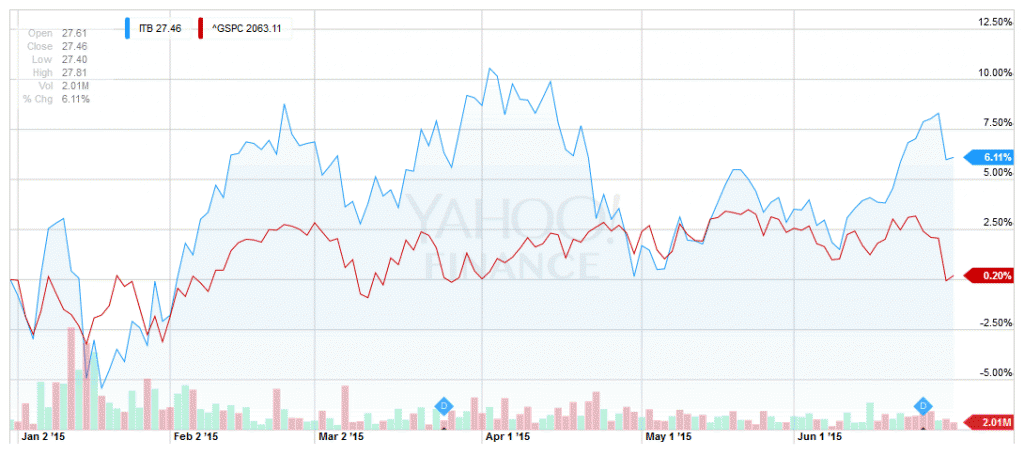
US Home Construction outperformed the S&P for the first half….
ITB
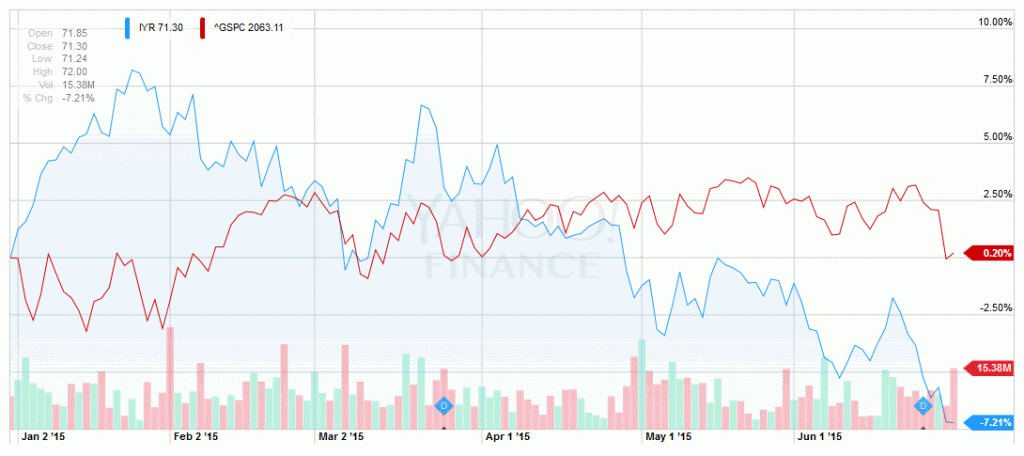
…while US Real Estate sunk, in part over concerns regarding rising interest rates.
IYR
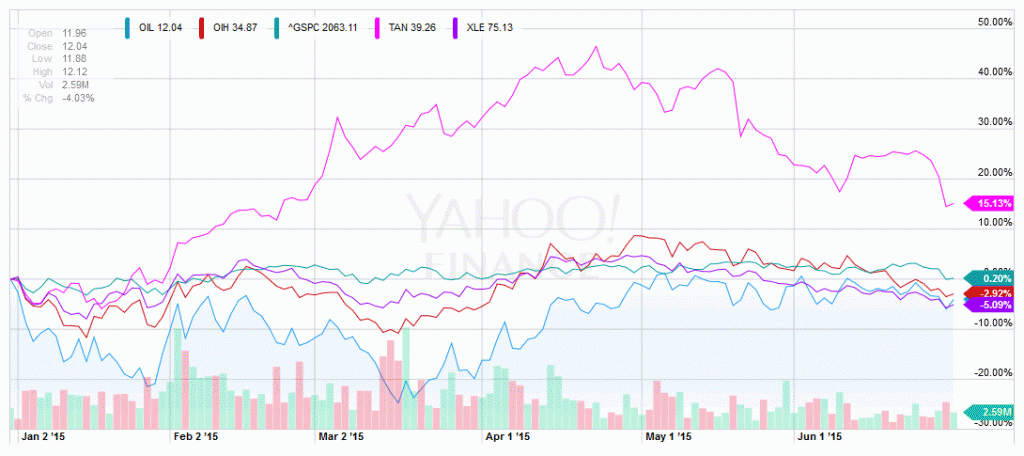
Oil was flat – no recovery in the oil patch yet. Solar was the energy group that did well in the first half.
OIL
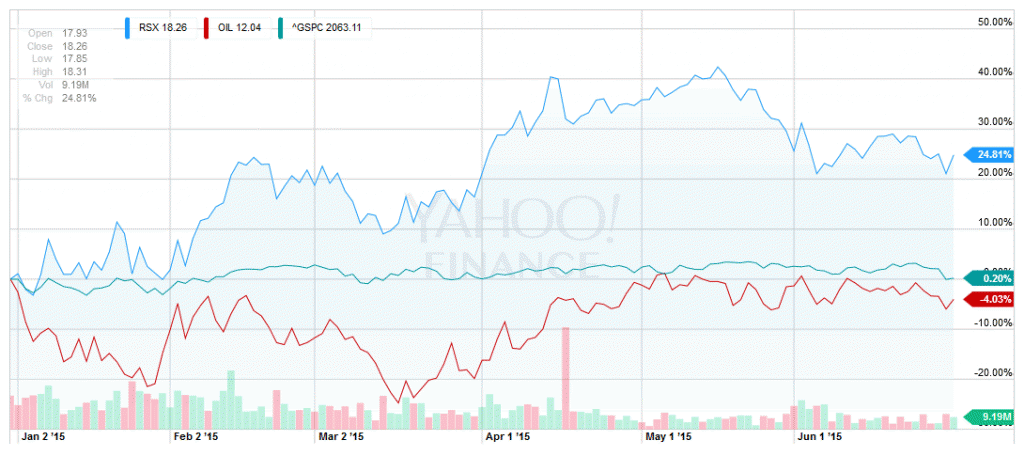
Despite the US continuing to play the “oil card,” the Russian markets recovered some of last years losses.
RSX (Russia), OIL
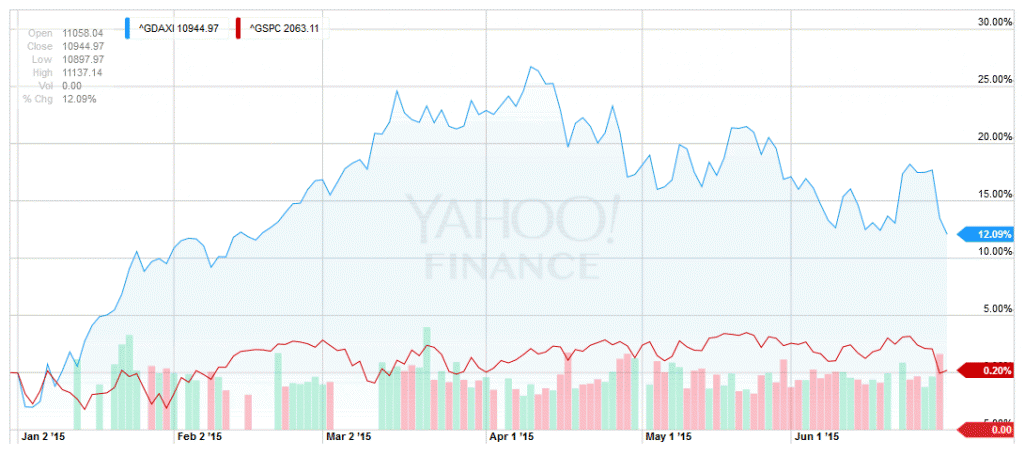
Germany continues to be one of the strongest markets, although giving up almost half of its 2015 gains in the last three months.
DAX (Germany)
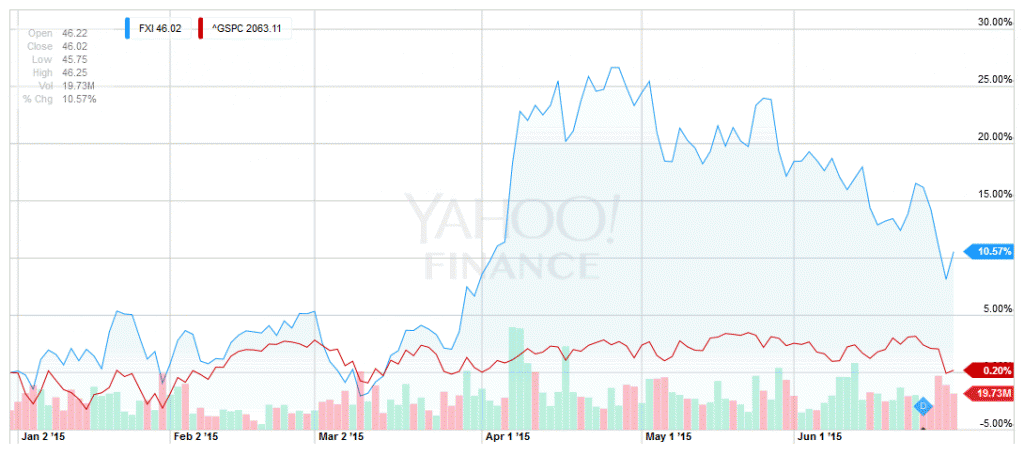
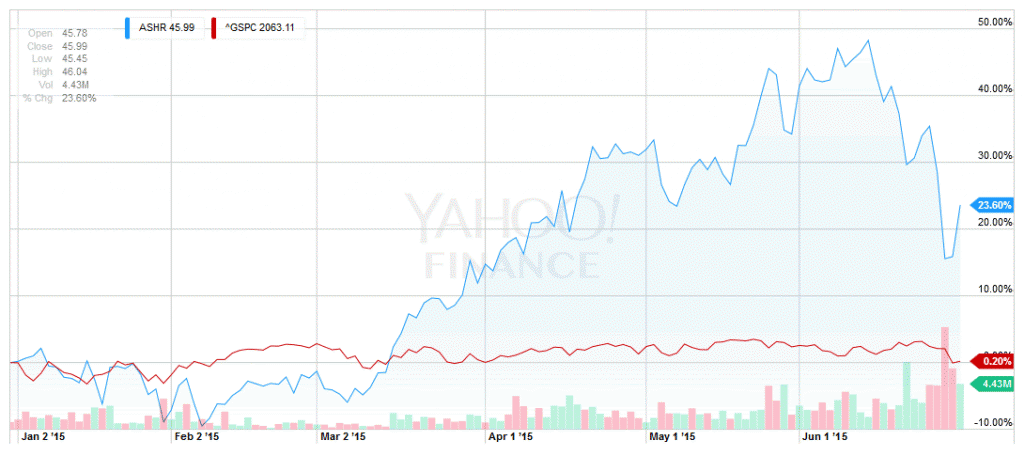
Chinese equities have also enjoyed a very strong 2015. May and June gave up almost half of the gains so far this year.
FXI (China Large Caps)
ASHR
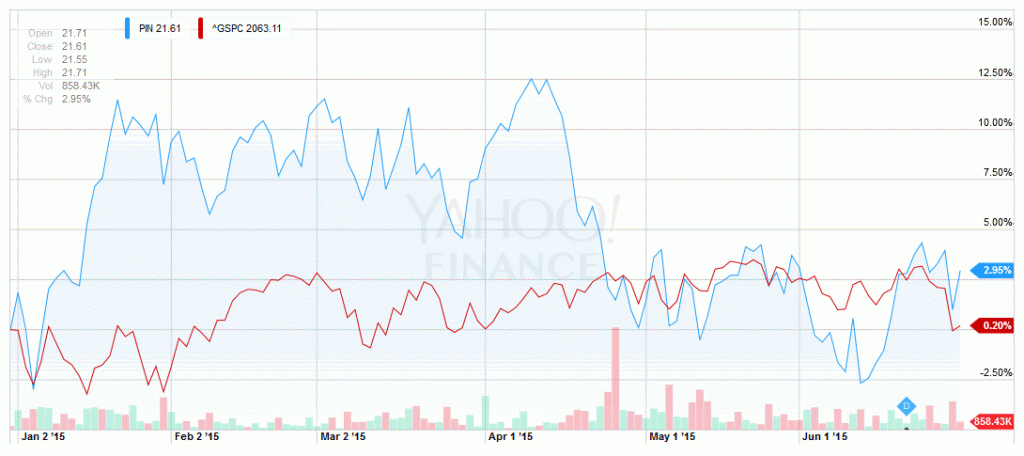
India also had a weak second quarter and ended up slightly for the year to date.
PIN (India)
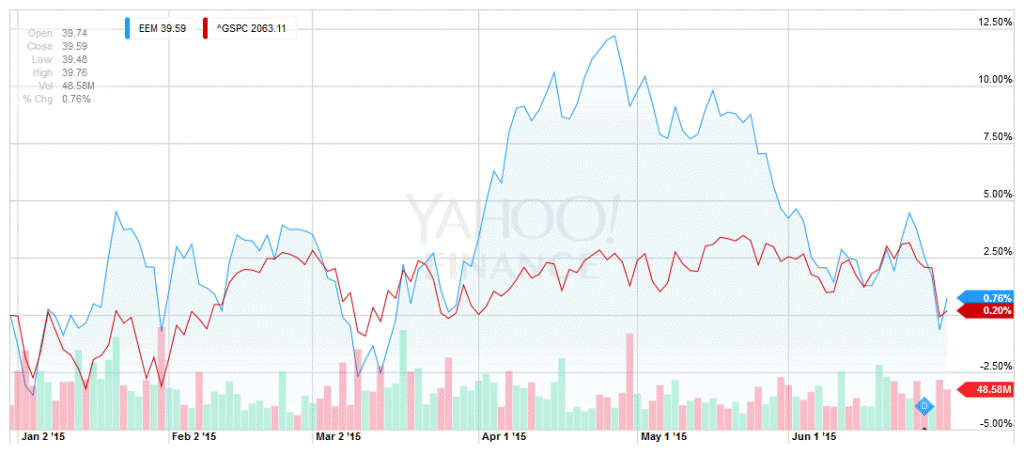
EEM (Emerging Markets)
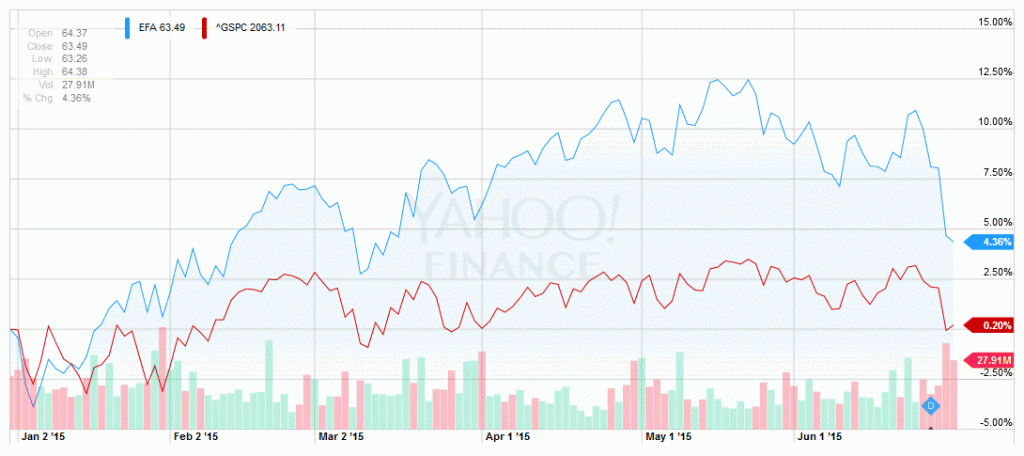
Internationally, the developed markets outperformed the emerging markets.
EFA (International Developed)
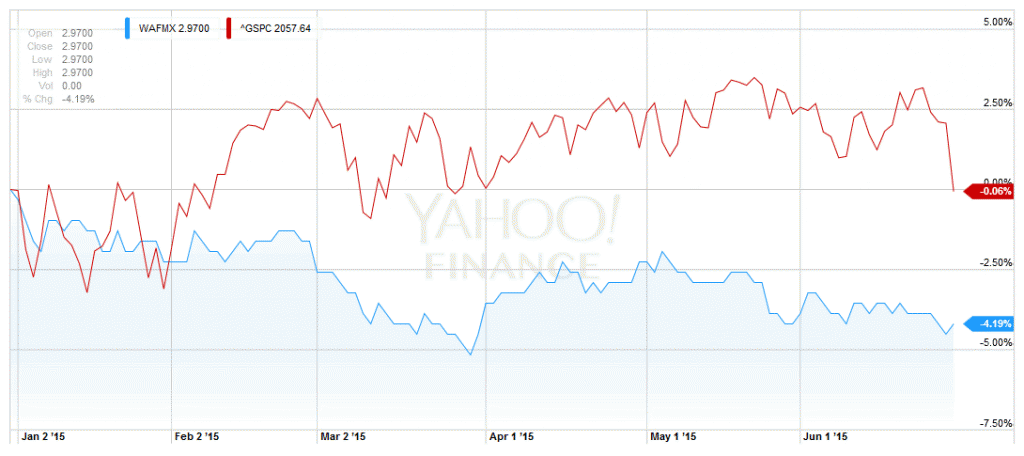
The frontier markets sagged.
WAFMX (Frontier Markets)
Fixed Income
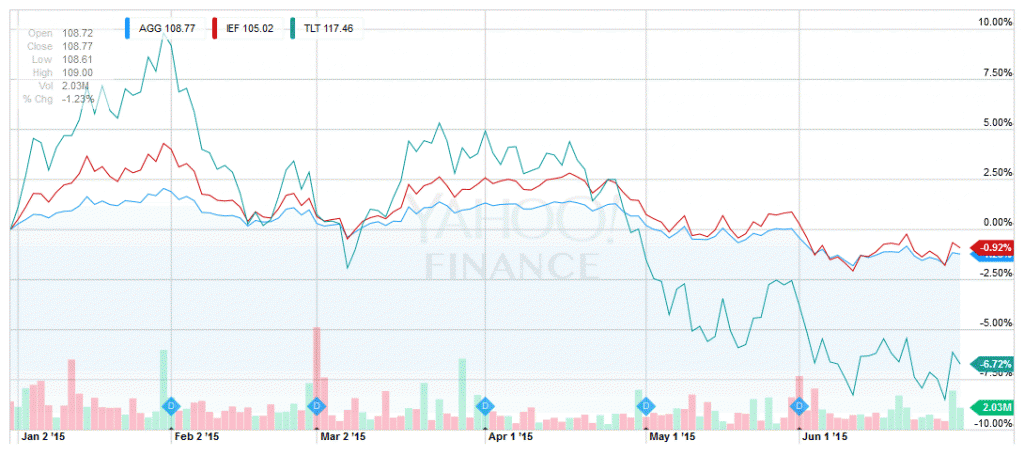
The turn in the fixed income market is upon us. Add dropping prices to low yields, and you have an unattractive combination.
AGG (Bond Aggregate), IEF(5-7yr Treasury), TLT (20yr+ Treasury)
Commodities
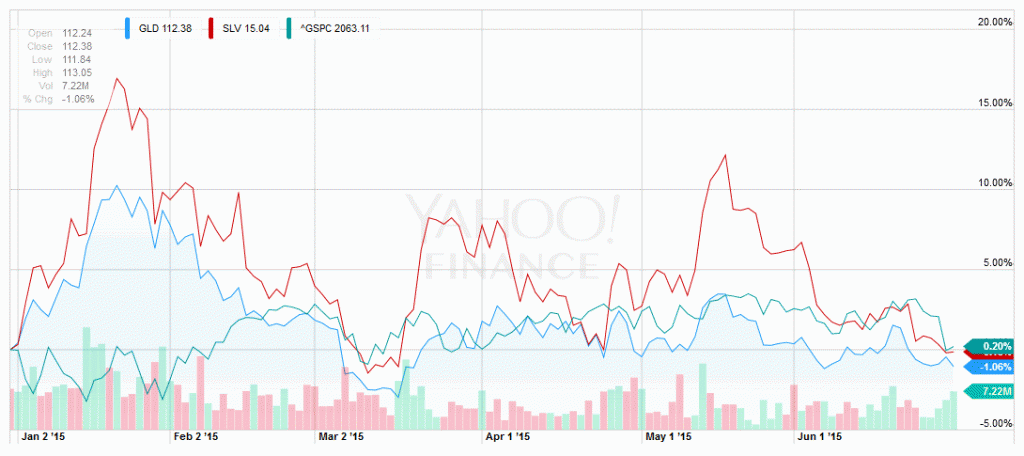
Precious metals continue to underperform and the charts look weak despite continuing efforts to lock up physical bullion inventory around the globe.
GLD (Gold), SLV (Silver)
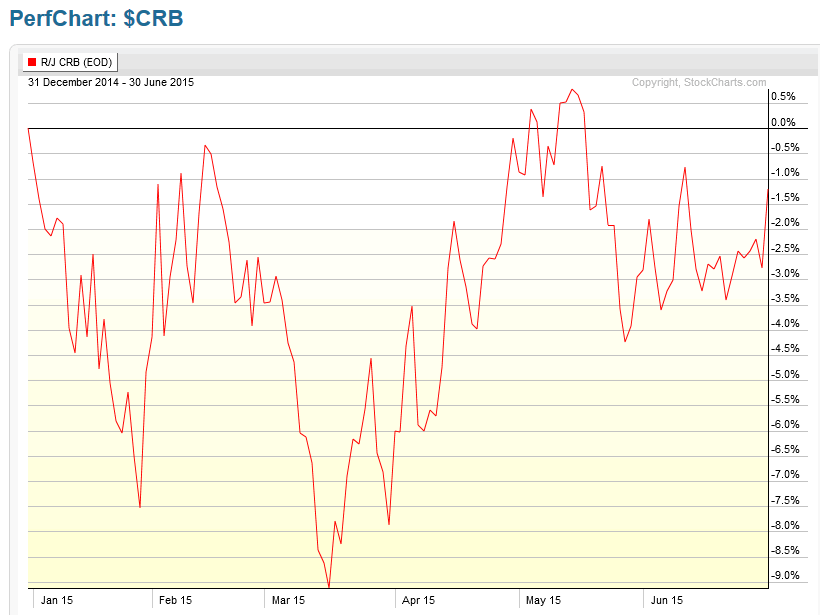
CRB (Commodities Index)
Commodities = up and down, up and down, with no change for the year.
A Look “Down Under”
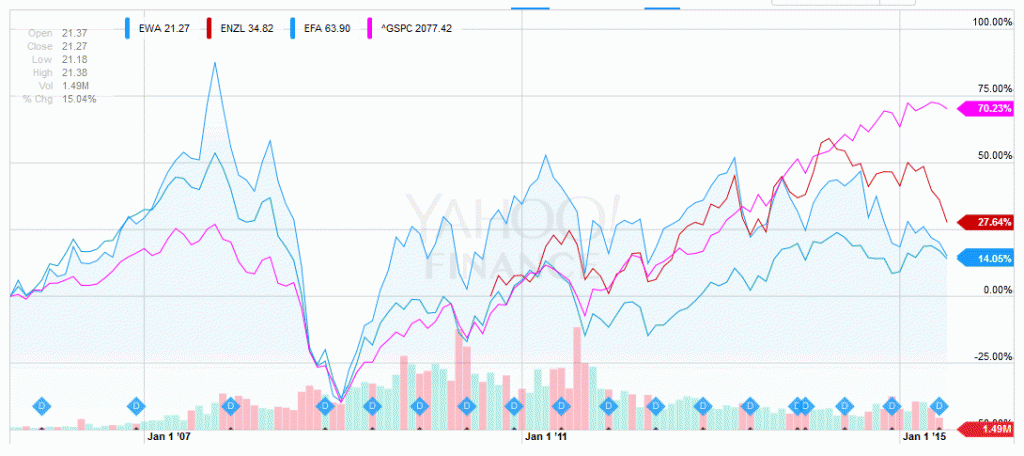
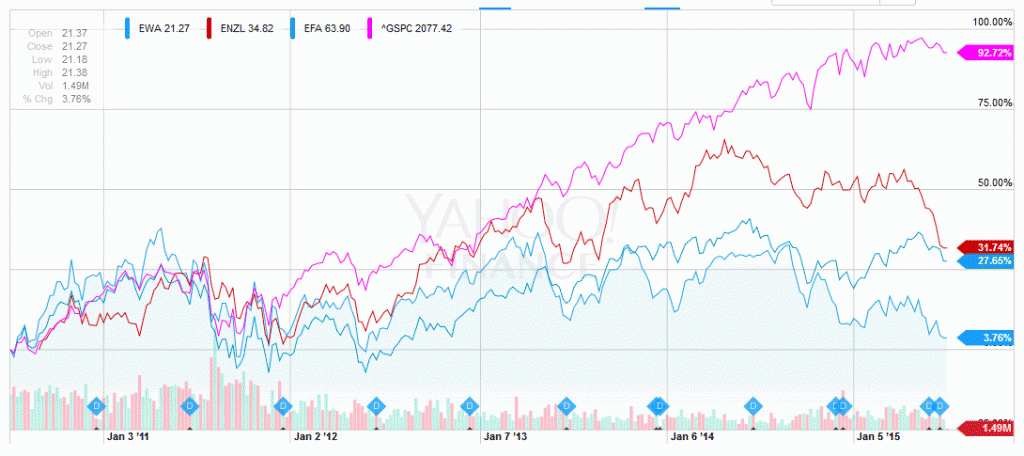
For many years, Australian equities enjoyed the demand for commodities created by growth in Asia, especially China.
EWA (Australia), ENZL (New Zealand) vs. EFA (Developed International) & S&P – 10 Years
Coming out of the 2008-9 financial crisis both Australia and New Zealand were trading up with other markets, with Australia out performing the S&P until the US market began to rise ahead of global markets in 2013.
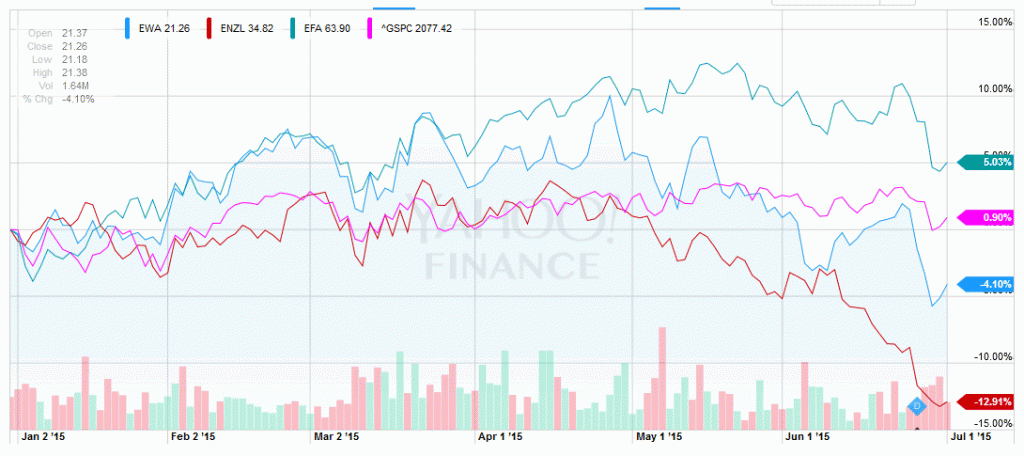
EWA (Australia), ENZL(New Zealand) vs. EFA(Developed International) & S&P – 5 Years
As the markets have dropped in the second quarter, Australia and New Zealand have dropped with them. New Zealand, in particular, is underperforming most markets.

