
By Chuck Gibson
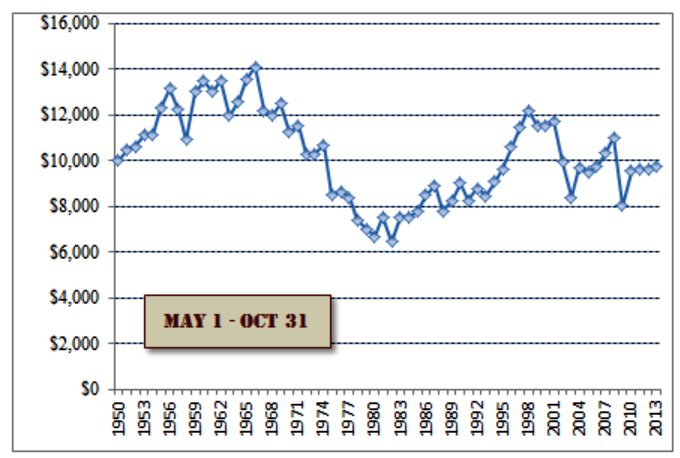
Since the calendar just turned its page to May I thought it good to visit that long standing Wall St. axiom regarding “Sell in May and go away (and live to see another day)”. For those not aware, it refers to the historically weak stock market during the periods of May through October and very strong performance for the remaining 6 months. I am not sure why it happens, there are lots of theories but it has been around for so long I think now it has become a self-fulfilling prophecy since it has so many followers. Regardless, this seasonality pattern really does have some very powerful statistical support. The charts below, courtesy of Breakpointtrades.com, show the data dating back to 1960 for the two time periods in question. Starting with $10k, if you invested the money at the start of May and pulled it out at the end of October every year, you cash pile would be slightly less than what you started with.
![]()