By Melanie Pelayo
Although Halloween is still a few weeks away, there were plenty of scary moments during the third quarter. Over the last few months, investors have seemingly been pummeled with bad news from every corner, and here are a few numbers that jumped out at me as the most frightening (the unemployment statistics will be familiar as they were covered very excellently in a blog from a couple of weeks ago).
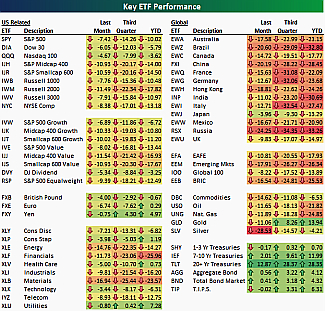
Below is a table that shows the performance of a large number of ETFs across all asset classes over the last month, quarter and year to date. Not surprisingly, for the third quarter, Europe took the trophy for the most miserable performance numbers. Russia (RSX) was down the most at -34.35%, followed by Italy (EWI) at -32.54%, Germany (EWG) at -32.06%, and France (EWQ) at -31.08%. These were the only ETFs across all asset classes that fell more than 30% during the quarter. Also, as noted earlier, the one asset class that benefitted from the negativity has been the long-term US bond. The best performing fixed income ETF has been the 20-Year+ Treasury ETF (TLT). As shown below, it was up 12.87% in September, 28.37% in the third quarter, and it’s up 28.35% year to date.
9.1%: The reported unemployment rate in August, which has been hover in the 9% range for the year. Job growth has remained sluggish as firms seem reluctant to deploy their cash hoards to hire more workers. High unemployment means fewer people with cash in their pockets to spend and drive consumer demand.
42.9%: The percentage of unemployed workers who have been out of work for more than 27 weeks. The large long-term jobless numbers imply that there is a major structural unemployment problem. Even though these 6 million workers have been idle for some time, corporate profits remain near record highs. A large group of people that don’t have the skills to compete doesn’t bode well for future growth.
14.8%: Unemployment rate among 20-24 year olds. Recent college grads and young adults have been hit hard by the recession. And many who can find a job are not working in their chosen field or are working far fewer hours than they’d like. It will take years for many people to make up the earnings and experience hole they are building themselves into now.
14.67%: The return of the Long-Term U.S. Government Bond index in the third quarter. Want to see what a flight to safety looks like? Look at the rush into long-term Treasuries even after the S&P downgrade of U.S. sovereign debt, due in large part to the continuing trouble in Europe. These investors’ fright underscores the problems facing the global economy and just how hard they will be to solve.
571,000: Seasonally adjusted annualized rate of housing starts in August. Housing starts remain way below the historical average of 1.5 million a year. With so much excess inventory, lack of demand, and difficulty of financing, it isn’t shocking this number is so low. But housing, and the jobs surrounding it, needs to come back for the economy to heal.
4.1%: The year-over-year decline in home prices in July according to the S&P/Case-Shiller Index. Even though home prices are off slightly from their absolute lows, they are still well below peak levels. Without confidence that home prices have truly bottomed, buyers aren’t going the jump into the market enthusiastically.
12: Members of the congressional supercommittee tasked with finding a solution to the United States’ fiscal problems. Given that it is difficult to get one member of Congress to agree with himself nowadays, finding a solution that is acceptable to all members seems far-fetched.
187: Ratio of U.S. debt held by the public to gross domestic product in 2035 if Congress keeps spending at current levels and keeps current tax levels and other polices, according to the Congressional Budget Office. This is up from 69 today and shows how critical tackling the deficit is.
10.6%: Percentage of annual GDP the federal government is expected to spend on health care in 2035, up from 5.6% today. Rising health-care costs will be a key driver of the deficit and an area on which the supercommittee will have to focus.
142: Estimated Greek sovereign debt/GDP ratio. The real number could be much worse as growth slows and the primary budget deficit remains unclosed.
440 billion: Size (in euros) of potential loan guarantees from the European Financial Stability Facility. If the crisis in the peripheral countries continues to grow to subsume Italy or Spain, this facility won’t do much to stave off pandemonium.
17: Number of countries in the eurozone. More importantly, the number of governments that need to agree on bailout terms and policy in order to keep the common currency viable.
1.3%: International Monetary Fund projection of German GDP growth in 2012. If Germany is going to drive European growth and lead bailouts, it will need to have much more robust production.

